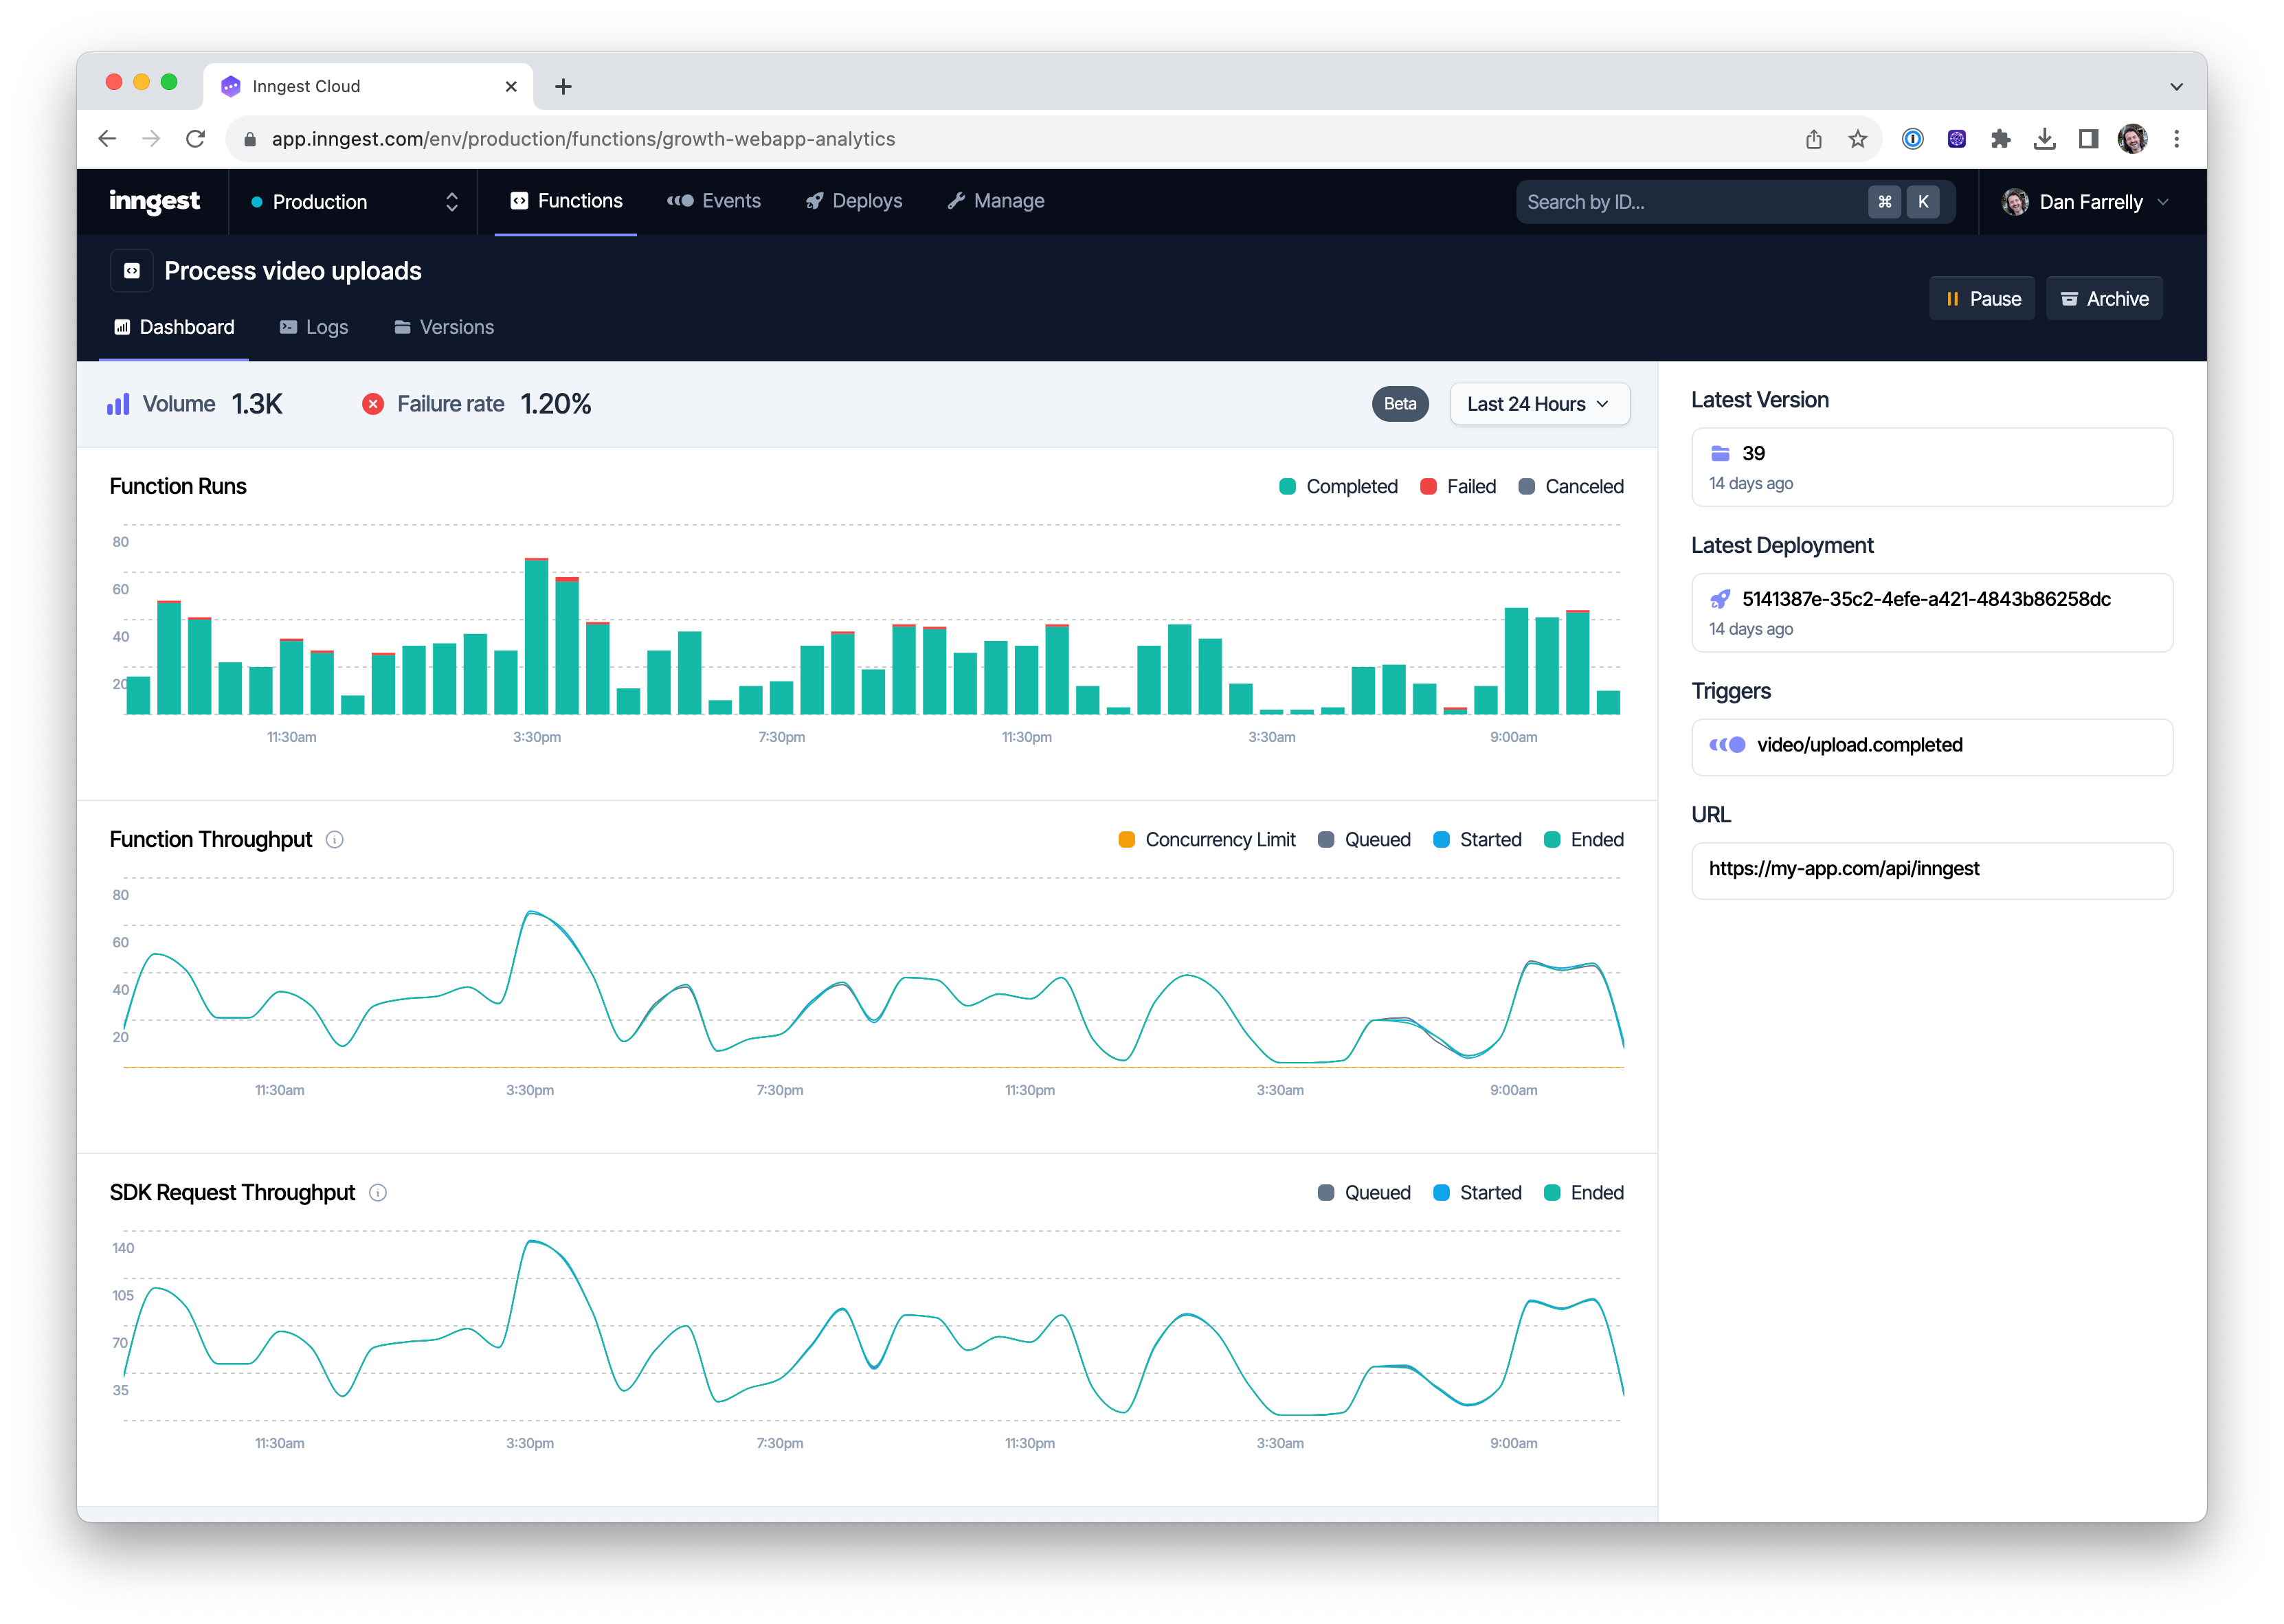
New in observability: Function Metrics
Darwin Wu· 10/30/2023 · 2 min read
We’re excited to announce function metrics as a beta feature! You can see the function throughput and SDK requests throughput charts on each of your function dashboard.

If you have concurrency settings enabled, the chart will also show you when those limits are hit, which will correlate with the charts showing function and steps being throttled.
Why metrics?
Providing observability into how background jobs and workflows are operating has never been simple to implement, and that’s on top of all the queues, pub/sub systems that must be operated to keep things running.
That’s true even when most tools today emit metrics in some fashion. You, as the maintainer or operator, will still have to make sure those metrics are:
- Ingested or pulled into your system,
- Scan through them to understand what could be relevant to monitor,
- Chart them into Dashboards,
- Potentially add alerting
And, of course, maintain all of the above as well.
Inngest’s goal is to provide you with the best experience possible when it comes to handling workflows, so you don’t have to worry about the cumbersome operations and focus on providing value to your customers.
Function metrics are one of the features to fulfill that goal.
What does it look like for other/existing tools?
If you have used any existing background job framework or open-source software, you know there’s nothing much to compare here.
No tool exists that will give you useful information out of the box, be it BullMQ, Sidekiq, Celery, Oban, Kafka, etc.
Metrics should be table stakes for any production system and we hope that as we improve Inngest, we can help drive the standards for existing tooling.
The future
With function metrics available, it has unlocked additional future features (e.g. alerting). Metrics will continue to improve, and we hope to get your feedback to make it more useful for you!
Help shape the future of Inngest
Ask questions, give feedback, and share feature requests
Join our Discord!